he two bar charts illustrate the changes in the overall population of a UK town and the proportion of people in different age groups from 1951 to 2011.
主体段分段:一图一段
开头段
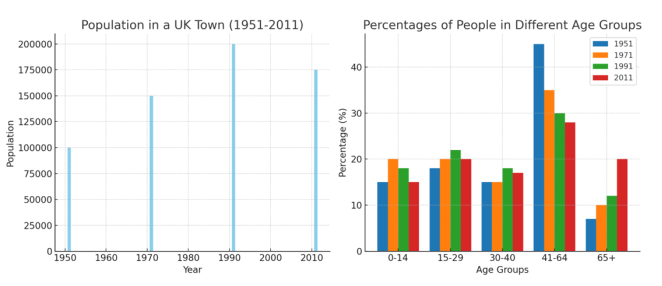
The bar charts illustrate the total population of a town in the UK and present how this population was distributed across five age groups from 1951 to 2011.
概述段
Overall, the town's population experienced a significant increase during the period. The middle-aged group (41-to-64-year-olds) consistently represented the largest proportion.
思路要点:
- 总人口呈上升趋势
- 41-64的人数一直最多
Body paragraph 1
According to the first bar chart, this town recorded an overall population of 100,000 in 1951, which then doubled to 200,000 in 1991. However, this was followed by a slight decrease to approximately 175,000 by 2011.
思路要点:
1950年人口为100,000→随后上涨了两倍,到1990年达到200,000→随后小幅度下降到2010年达到175,000
Body paragraph 2
Regarding the distribution across age groups, older individuals constantly made up a larger share of the population. The 41–64 age group dominated throughout the period, although their figure dropped significantly from 47% in 1951 to 38% in 2011. By contrast, the percentage of those aged 65 and over nearly tripled, reaching 20% by the end of the period. Younger age groups showed less dramatic changes. Despite minor fluctuations, the proportion of children aged 0-14 remained relatively stable at 15%. Meanwhile, the 15–29 and 30–40 age groups peaked at 21% and 18% in 1991, before falling slightly to 20% and 17% in 2011.
思路要点:
- 41-64:占比始终最·高,从1951年的47%急剧下降到2011年达到38%
- 65+:1951到2011年间上涨了3倍达到20%
- 其余三个年龄段数值变化幅度较小
- 0-14:经历轻微波动,但数值稳定在15%
- 15-29、30-40:1991年都达到峰值21%和18%→2011年都小幅度下降到20%和17%