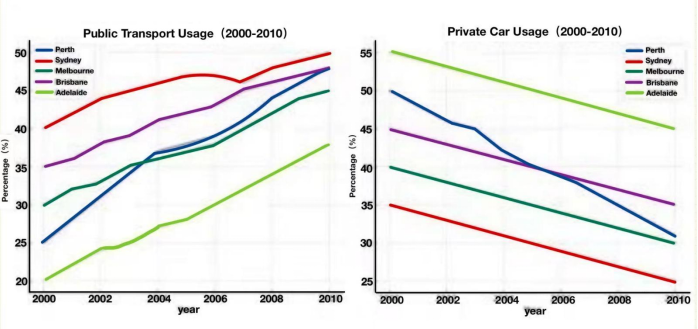
These lines below show the percentages of people using public transports and private cars between 2000 and 2010.
主体段分段:
方法1:一图一段
方法2:按照<城市>分段(本篇文章采用此种分段方法)
主体1:Sydney、Adelaide
主体2:Brisbane、Melbourne、Perth
开头段
The line graphs illustrate the changes in commuter preferences for public transport and private cars across five cities in Australia (Perth, Sydney, Melbourne, Brisbane and Adelaide) from 2000 to 2010.
概述段
Overall, all five cities saw an upward trend in the use of public transport, a pattern mirrored by a corresponding decline in the reliance on private cars. Among them, Perth registered the most pronounced transformation.
思路要点:
- 五个城市的public transport使用率都上升,private cars使用率都下降
- Perth变化幅度显著
Body paragraph 1
Interestingly, Sydeny and Adelaide witnessed a complete reversal in their rankings regarding the use of the two transpord modes. After growing gradually from 40% to 47% between 2000 and 2005, the percentage of public transport users in Sydney dipped slightly by 2% in 2007, before bouncing back to 50% by 2010. Similarly, Adelaide’s public transport usage jumped from 20% to 38%, although it still recorded the lowest proportion among the five cities. However, private car usage in both cities fell considerably to 25% and 45% by 2010.
思路要点:Sydney、Adelaide
- Sydney和Adelaide的public transport usage与private car usage排名完全相反
- Sydney的public transport usage:2000到2005年由40%逐渐上升到47%→随后到2007年小幅下降了2%→到2010年上涨回50%
- Adelaide的public transport usage:2000到2010年间从20%急剧上升到38%,但数值依旧最·低
- 两个城市的private car usage都显著下降,2010年达到25%和45%
Body paragraph 2
Although there were minor fluctuations, public transport usage in Brisbane and Melbourne increased significantly to 46% and 43% respectively in 2010. In contrast, the share of private car users in these two cities fell steadily to 34% and 30% during the same period. Perth also recorded a dramatic rise in public transport use, overtaking Melbourne’s figure in late 2003 and reaching 46% by 2010. This contributed to a noticeable drop in its private car usage from 50% in 2000 to just 31% a decade later.
思路要点:Brisbane、Melbourne、Perth
- Brisbane、Melbourne的public transport usage显著上升,2010年达到46%和43%;但这两个城市的private car usage逐年下降到34%和30%
- Perth:public transport usage也急剧上升,2003年末超过Melbourne的使用量,2010年达到46%;private car usage由2000年的50%显著下降到2010年的31%