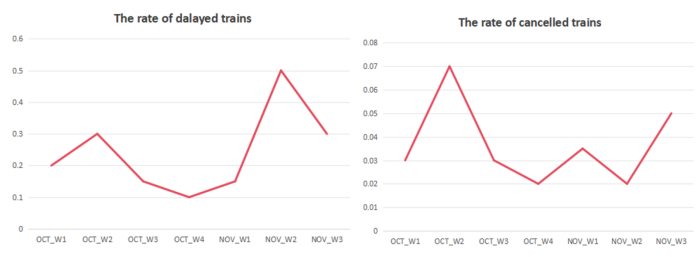
he graphs below show the change in rates of delayed trains and cancelled trains from the first week in October to the third week in November.
主体段分段:一图一段
开头段
The two line graphs illustrate the weekly percentages of train delays and cancellations over a seven-week period from early October to mid-November.
概述段
Overall, both the delay and cancellation rates experienced noticeable fluctuations over the period. While delays peaked in mid-November, the highest cancellation rate occurred in mid-October.
思路要点:
- 延误率、取消率整体都呈现上升趋势,伴随显著波动
- 十一月延误率更高,十月取消率更高
Body paragraph 1
In terms of the rate of delays, there was a modest rise from 20% in the first week of October to 30% a week later, followed by a noticeable drop to a low of 10% by the end of October. After a surge to a peak of 50% in the second week of November, this figure declined rapidly by 20% in the subsequent week.
思路要点:
延误率
- 从OCT_W1到OCT-W2,从20%小幅度上升到30%→随后显著下降到OCT_W4达到10%→到NOV-W2上涨5倍→到NOV-W3急剧下降
Body paragraph 2
Similar variations were also exhibited in cancellations. The rate began at 3% in the first week and soared to 7% in the second week of October, before falling sharply to the original level in the next week. The following three weeks experienced a period of fluctuations between 2% and 3.5%, after which a remarkable growth was recorded to 5% in the third week of November.
思路要点:
取消率
- 取消率也经历了显著波动
- OCT_W1取消率为3%→急剧上升,OCT_W2达到7%→OCT_W3急剧下降回3%→随后,到NOV_W2在2%-3.5%之间波动→到NOV_W3显著上升达到5%