题目:
The charts below give information about education in Singapore from the years 2000 to 2010.
主体段分段:一图一段
开头段
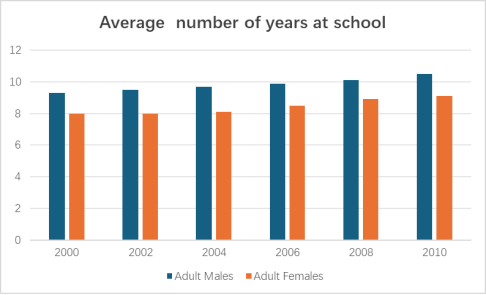
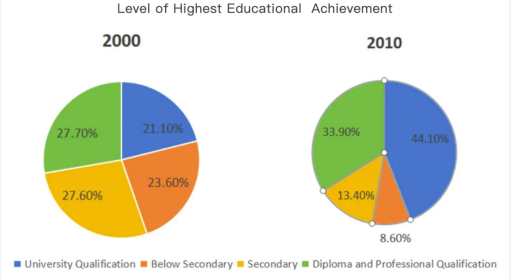
The bar chart compares the number of school years for males and females in Singapore from 2000 to 2010, while the pie charts illustrate changes in the highest level of education attained during the same period.
概述段
Overall, both genders experienced an increase in the length of education over the decade, contributing to a rise in the overall educational attainment in Singapore between 2000 and 2010.
思路要点:
- 男女的受教育实践都上升
- 新加坡整体教育水平上升
Body paragraph 1
In terms of schooling years, men consistently had a longer duration of education than females throughout the given period. Males’ schooling years recorded a gradual increase, rising slightly from 9 years in 2000 to 10.5 years in 2010. In contrast, females had 8 years of education from 2000 to 2003, after which there was a noticeable climb to 9 years by 2010.
思路要点:
- 男性受教育时间始终高于女性
- Males:2000年至2010年小幅度上升
- Females:2000-2002年数值不变→到2010年显著上升
Body paragraph 2
According to the pie charts, the proportion of people with university qualifications exhibited the most significant growth, rising sharply from 21.1% in 2000 to 44.1% in 2010. The percentage of diploma and professional qualification holders also increased, but more moderately, climbing marginally from 27.7% to 33.9%. Conversely, the proportion of people with secondary education halved to 13.4%, and the figure for below-secondary group plunged to merely 8.6% during the same period.
思路要点:
- University Qualification:急剧上升
- Diploma and professional qualification:小幅度上升
- Secondary education:下降了一半
- Below secondary:急剧下降