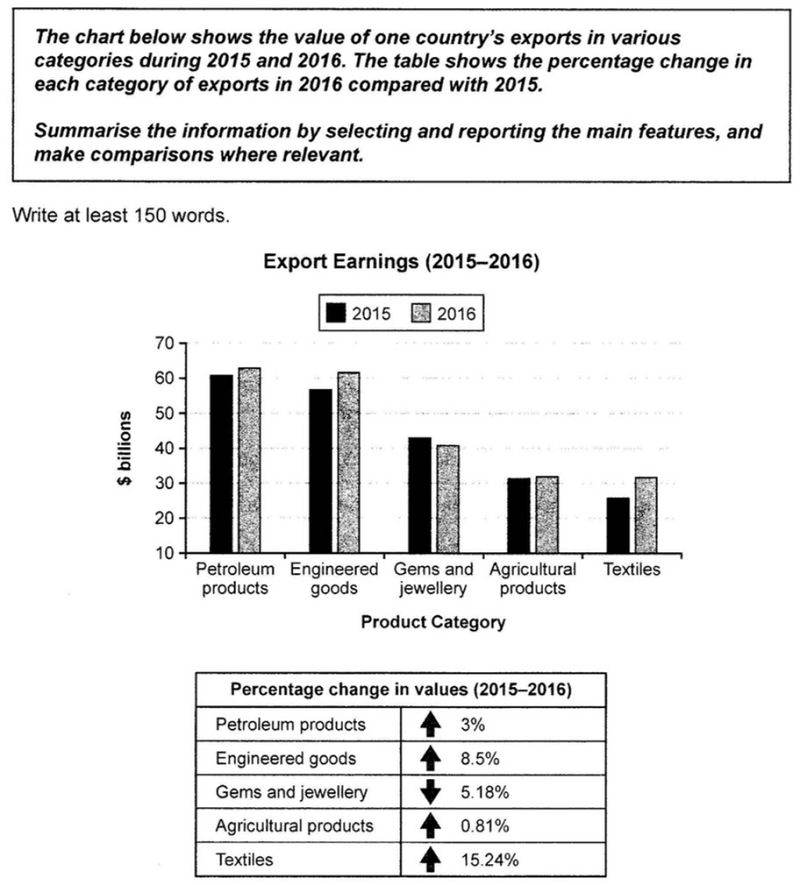
数据图:【线图】+【表格】
主要描述:这个线图比较特殊,主要看到【比较】,当然有【变化】,只不过老章的思路是不以线性变化为主。表格自然是【比较】。
【不同时间】+【不同项目】。不但有项目之间的比较,还有两个年份之间的比较。

# Introduction
Shown in the bar chart and the table are the value of one country’s export earnings made by five categories of goods from 2015 to 2016, as well as the increased or decreased value of each category over the same time. 划线部分是倒装形式,可以当成模板套用,只是要注意:动词处的单数还是复数由后面的名词决定。
# Body
首先,老章提醒:学会分组。柱图中,petroleum products 和 engineered goods 一组,齐头并“高”。Gems and jewelry 和 agricultural products 以及 textiles 一组,差不多。然后按照分组来写。
同时特别注意:表格可以融入柱图去写:
Petroleum products and engineered goods were the two leading categories, making more or less 60 billion dollars in both years, and the year of 2016 saw a greater increase in engineered goods than in petroleum products, 8.5% compared with 3%.
The following category, considerably less valuable than those two categories, was gems and jewelry, whose earnings were at the 40-billion-dollar level. In addition, this category, different from the others, experienced a decline (minus 5.18%) in its earnings. In terms of the earnings of agricultural products and those of textiles, they both were at the next level down – the 30-billion-dollar level. In addition, it is noteworthy that 2016’s growth (15.24%) in the category of textiles is marked.
* 主语的丰富多样。
* 动词分词引导的伴随状语。
* 第二个划线处:其实是独立主格结构作状语:主句是比较级,状语是 A数字compared with B数字。
* 第三个划线处:状语插入在主语后,状语形式为形容词比较级。
* 第四个划线处:状语插入在主语后,状语形式为形容词固定短语。
# Conclusion
Overall, growth is the general trend, and it varied vastly from category to category.
* something varies from xx to xx.
* 老章一再强调:对于图表情况的总述要么在Introduction里,要么在Conclusion里,总之一定要有。
* 如果在总述图表情况的时候,发现其中一个图表的总述不好写,就不写,也可以,不用纠结。